Dessalines@lemmy.ml to Data Is Beautiful@lemmy.ml · 5 months agoWorld Incarceration Rates If Every U.S. State Were A Country (No other country even makes the first page)lemmy.mlimagemessage-square66fedilinkarrow-up1273arrow-down17file-text
arrow-up1266arrow-down1imageWorld Incarceration Rates If Every U.S. State Were A Country (No other country even makes the first page)lemmy.mlDessalines@lemmy.ml to Data Is Beautiful@lemmy.ml · 5 months agomessage-square66fedilinkfile-text
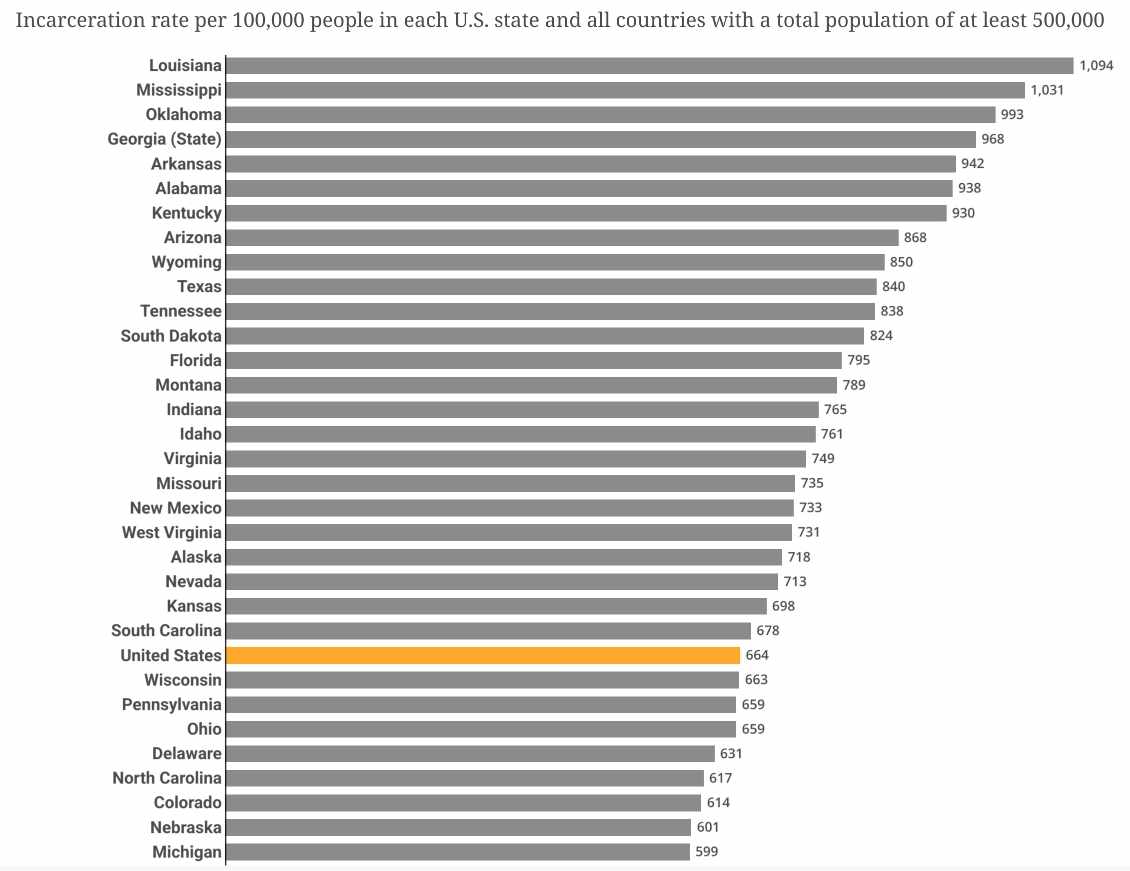
minus-squareCoreidan@lemmy.worldlinkfedilinkEnglisharrow-up3arrow-down4·edit-25 months agoI don’t get this graph. So all of US has a smaller incarceration rate than just Louisiana? What?
minus-squareDessalines@lemmy.mlOPlinkfedilinkarrow-up9·5 months agoYes, look up what per capita means.
minus-squareEvil_Shrubbery@lemm.eelinkfedilinkarrow-up8·5 months agoThats how averages work, unlike eg maximums. But Im sure reversing that chart would correlate with math test scores.
minus-squarepyre@lemmy.worldlinkfedilinkarrow-up8·edit-25 months agoi have 4 boxes labeled A to D, and 10 rocks. i put 1 rock in A, 2 in B, 3 in C and 4 in D. A[⚪] B[⚪⚪] C[⚪⚪⚪] D[⚪⚪⚪⚪] i then paint 1 rock in B, 2 rocks in C and 1 rock in D. A[⚪] B[⚪🔴] C[⚪🔴🔴] D[⚪⚪⚪🔴] then i put the boxes in a bigger box called the united boxes. here’s the rate of painted rocks: C 66% (2/3) B 50% (1/2) United boxes 40% (4/10) D 25% (1/4) A 0% (0/1)
minus-squareAstridWipenaugh@lemmy.worldlinkfedilinkarrow-up6·edit-25 months agoThe US average falls in the middle of the list of states, yes. This is a chart of per capita rates.
minus-squaretonyn@lemmy.mllinkfedilinkarrow-up2·5 months agoThe entire US would have the average of all the states’ incarceration rates.


I don’t get this graph. So all of US has a smaller incarceration rate than just Louisiana? What?
Yes, look up what per capita means.
Thats how averages work, unlike eg maximums.
But Im sure reversing that chart would correlate with math test scores.
i have 4 boxes labeled A to D, and 10 rocks.
i put 1 rock in A, 2 in B, 3 in C and 4 in D.
i then paint 1 rock in B, 2 rocks in C and 1 rock in D.
then i put the boxes in a bigger box called the united boxes.
here’s the rate of painted rocks:
The US average falls in the middle of the list of states, yes. This is a chart of per capita rates.
The entire US would have the average of all the states’ incarceration rates.